Effective Ways to Find the Confidence Interval in Statistics (2025)
Effective Ways to Find the Confidence Interval in Statistics
Understanding Confidence Interval in Statistics
The **confidence interval** is a crucial concept in **statistics**, serving as a range of values that estimate a population parameter, such as the **population mean**. This statistical tool allows researchers and analysts to quantify the uncertainty surrounding their estimates. Typically expressed in the form of a lower and upper limit, the confidence interval provides insight into the **precision of the estimate** derived from a sample. The width of the interval is influenced by several factors, including the **sample size**, the **standard deviation**, and the designated **confidence level**—commonly set at 95% or 99%. Understanding how to calculate and interpret a confidence interval is vital for effective **data analysis** and **statistical inference**.
Components of a Confidence Interval
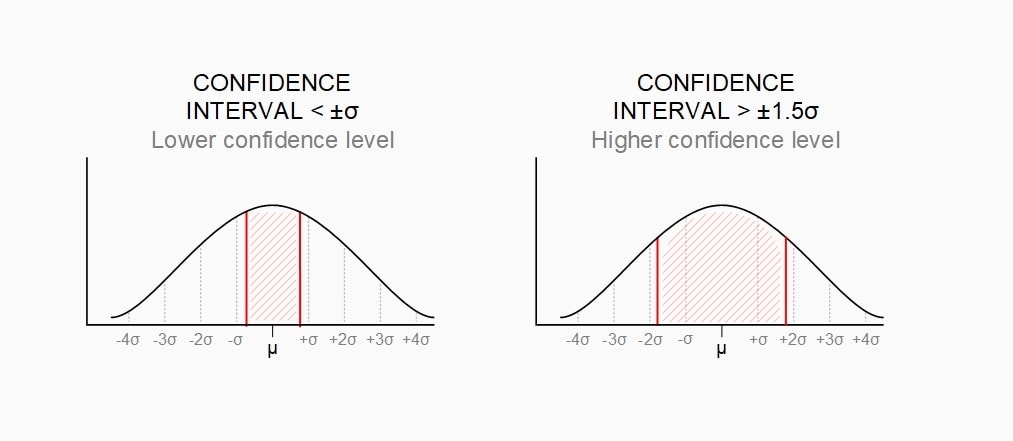
A confidence interval consists of two main components: the **point estimate** and the **margin of error**. The point estimate represents the best guess of the population parameter based on the sample data. For example, if you’re estimating the average weight of a population, the sample mean acts as the point estimate. The **margin of error** is derived from the desired confidence level, the **standard deviation** of the sample, and the sample size. Higher confidence levels result in larger margins of error, while larger sample sizes lead to narrower intervals due to decreased variability. Understanding these components is essential for constructing accurate confidence intervals.
Steps to Calculate Confidence Interval
To calculate a confidence interval for a population mean, begin by determining the sample mean (the point estimate) and the standard deviation (or standard error). If the sample size is small (n < 30) and the population standard deviation is unknown, utilize the **t-distribution** for calculations. The following steps outline the general process:
- Calculate the sample mean (x̄).
- Determine the standard deviation (s) of the sample.
- Find the appropriate t-value or z-score based on your selected **confidence level**.
- Calculate the standard error (SE) by dividing the standard deviation by the square root of the sample size (n).
- Multiply the standard error by the t-value or z-score to determine the margin of error.
- Finally, construct the confidence interval by adding and subtracting the margin of error from the sample mean.
This systematic approach allows researchers to derive meaningful statistical insights and enhances **interpretation of results**.
Importance of Sample Size and Standard Deviation
The size of the sample and its variability play significant roles in determining the **confidence interval**. A larger sample size reduces most variability, leading to a more accurate representation of the population. When considering the relationship between sample size and confidence intervals, applying the **central limit theorem** is helpful. This theorem states that as the sample size increases, the sampling distribution of the sample mean approaches a normal distribution, irrespective of the population’s distribution.
Impact of Sample Size on Confidence Intervals
As the sample size increases, confidence intervals become narrower, indicating increased **precision** in estimating the population parameter. A common rule of thumb is that increasing the sample size exponentially decreases the margin of error. For instance, a researcher analyzing survey data with a small sample size may report extensive uncertainty in their confidence intervals. However, by increasing this sample size, they can achieve more precise estimates, minimizing the uncertainty and enhancing reliability in **quantitative research**.
The Role of Standard Deviation in Interval Estimates
The standard deviation dictates the spread of the data within the sample. A low standard deviation signifies that the data points are close to the mean, resulting in narrower confidence intervals. On the other hand, high variability within the data can inflate the confidence intervals, indicating lower precision in the estimate. It is essential to assess the standard deviation before drawing conclusions regarding the **margin for error** and the overall research findings. Statistical analysis tools can assist in visualizing how changes in standard deviation affect the **confidence limits**.
Interpretation of Confidence Intervals
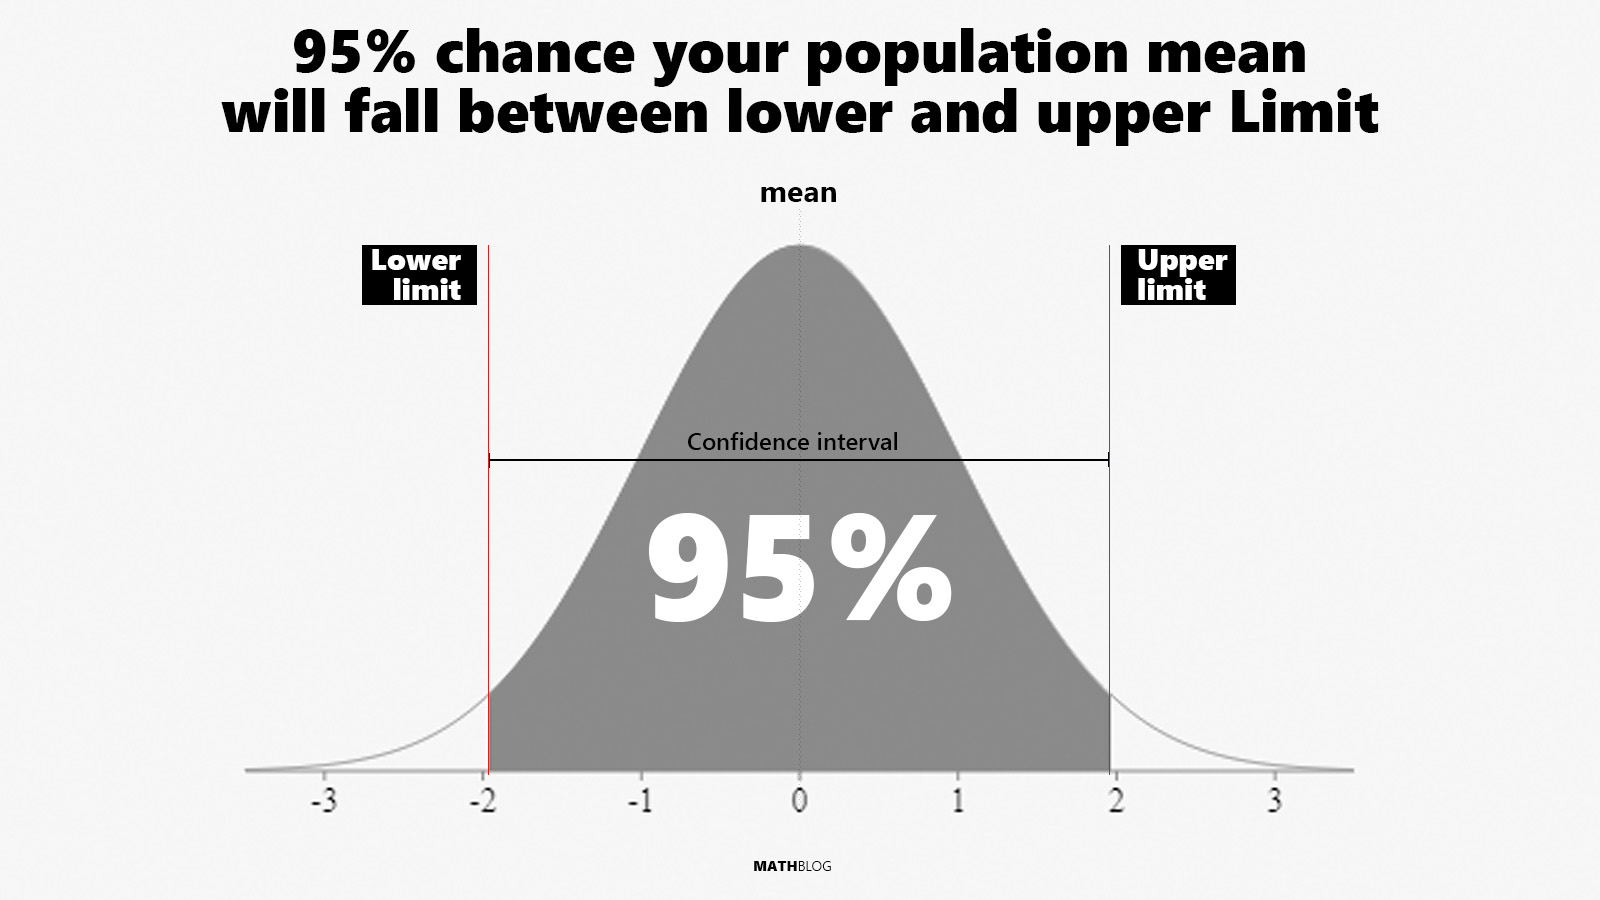
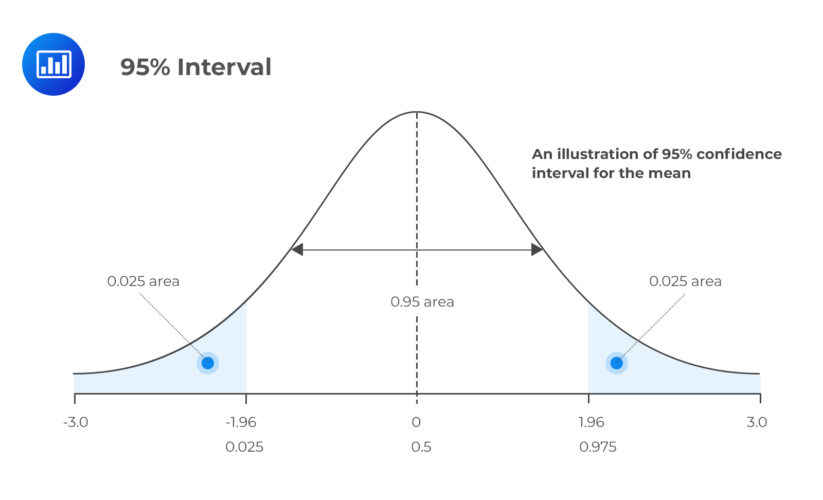
Understanding the interpretation of a confidence interval is crucial in **hypothesis testing** and decision-making processes. A confidence interval does not imply the likelihood that the parameter lies within the interval, rather it reflects the reliability of the interval estimation based on repeated sampling. For instance, if we were to draw numerous samples and compute their confidence intervals, we expect that approximately 95% of those intervals would contain the true population mean if the confidence level is set at 95%.
Common Misinterpretations of Confidence Intervals
A frequent error occurs when users interpret confidence intervals as providing the probability that a specific parameter falls within the range. Instead, they should understand confidence intervals in the context of repeated sampling processes. The correct interpretation focuses on how confidence intervals provide insight into the **uncertainty quantification** surrounding estimates. A narrow interval represents greater precision, while a broader interval reflects higher uncertainty. Misunderstanding the basics of interpreting confidence intervals can lead to flawed conclusions in both **empirical research** and practical applications.
Application of Confidence Intervals in Research
In the context of **research methodology**, confidence intervals are widely employed in various fields including medical research, economics, and social sciences. For instance, clinical trial results may report confidence intervals to show effectiveness of a new medication. Suppose researchers claim that a new drug lowers high blood pressure with a 95% confidence interval of 20 to 30 mm Hg. This interval allows doctors to understand the range within which the true mean reduction in blood pressure is likely to fall, aiding in clinical decision-making. Understanding the application of confidence intervals is essential for evaluating research findings critically while making informed decisions.
Statistical Procedures for Confidence Intervals
Different statistical methods apply when estimating confidence intervals based on the type of data and research design. **Parametric tests**, which assume underlying population distributions, can use the z-distribution or t-distribution for constructing confidence intervals. In contrast, **non-parametric tests** may offer alternative approaches that do not require stringent assumptions.
Confidence Intervals with Z and T Distributions
The choice between the z-score and t-score for confidence intervals often depends on the sample size and whether the population standard deviation is known. The z-score is typically applicable for larger samples (n ≥ 30), while the t-distribution should be used for smaller samples. Calculating confidence intervals using the appropriate distribution ensures accurate estimation and draws valid conclusions about the data.
Cautions with Confidence Interval Calculation
While constructing confidence intervals, it is essential to consider potential biases in sampling. Errors such as **sampling error** can distort results and lead to inaccurate confidence interval estimates. Researchers should ensure proper execution of **random sampling** or appropriate **systematic sampling** methods, adhering closely to **sampling theory** guidelines. Awareness of these pitfalls enhances the robustness and credibility of the findings. Comprehensive statistical procedures ensure valid confidence interval calculations and contribute to valid **statistical inferences**.
Key Takeaways
- The **confidence interval** provides a range of values that estimate a population parameter, crucial for statistical analysis.
- Factors like **sample size**, **standard deviation**, and the **confidence level** significantly affect confidence intervals.
- Proper interpretation of confidence intervals is essential to avoid common misjudgments.
- Statistical methods such as z- and t-distributions facilitate accurate interval estimation based on data characteristics.
FAQ
1. What is a confidence interval, and why is it important in statistics?
A confidence interval represents a range of values estimated from a sample that is likely to encompass the true population parameter. It is essential because it quantifies the uncertainty around point estimates, aiding in the reliability of conclusions drawn from data analysis.
2. How does sample size affect confidence intervals?
The sample size directly influences the width of the confidence interval; larger sample sizes result in narrower intervals, indicating increased precision. This enhanced accuracy is vital for reliable data interpretation and analysis.
3. Can I use the confidence interval for ordinal data?
Confidence intervals are generally designed for continuous data rather than ordinal data. However, specific techniques exist to derive confidence intervals for ordinal scales, often requiring non-parametric methods for valid estimation.
4. What is the difference between z-scores and t-scores in confidence intervals?
Z-scores are used for large samples (typically n ≥ 30) assuming the population variance is known, while t-scores apply to smaller samples where the population standard deviation is unknown. The t-distribution accounts for extra variability in smaller samples, thus yielding wider confidence intervals.
5. What are common mistakes when interpreting confidence intervals?
A typical mistake is assuming that a confidence interval provides the probability of the parameter being within the range, rather than reflecting how often intervals from repeated sampling will contain the true parameter. Awareness of this distinction is crucial for accurate interpretation and decision making.
6. How do confidence intervals relate to hypothesis testing?
Confidence intervals can be employed in hypothesis testing to determine if a particular value (like the null hypothesis) falls within the computed interval. If it does, researchers may fail to reject the null hypothesis. This relationship underscores the importance of confidence intervals in statistical analyses.
7. What statistical software can help compute confidence intervals?
Several statistical analysis software packages, such as R, SPSS, and Python’s SciPy, offer functions to compute confidence intervals for various data types. These tools facilitate quick analysis and adept data interpretation without manual calculations.