How to Properly Find Standard Deviation in Excel: Essential Tips for 2025
How to Properly Find Standard Deviation in Excel
Understanding how to find standard deviation in Excel is crucial for data analysts, statisticians, and anyone dealing with numerical data. Whether you’re conducting business analytics or carrying out academic research, being proficient in calculating standard deviation can enhance your data interpretation and reporting. This guide delves into the essential methods to calculate standard deviation in Excel, complete with examples and practical tips for 2025.
Understanding Standard Deviation in Excel
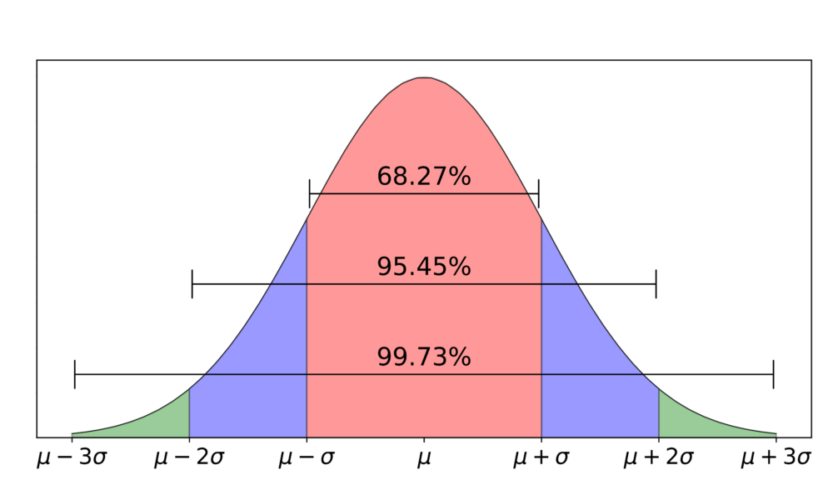
Before diving into the calculation methods, it’s important to grasp the concept of standard deviation. Essentially, standard deviation measures the amount of variation or dispersion in a set of values. When the data points are close to the mean, the standard deviation is low, indicating that the data points typically fall near the mean. Conversely, a high standard deviation suggests that the data points are spread out over a wider range of values. Understanding standard deviation is fundamental to performing statistical analysis in Excel.
What is the Standard Deviation Formula?
The standard deviation formula is pivotal to calculating the standard deviation in Excel. It is typically represented as the square root of the variance. The formula for sample standard deviation (\(s\)) is:
\(s = \sqrt{\frac{\sum (x – \bar{x})^2}{n-1}}\)
Where \(x\) represents each value in the data set, \(\bar{x}\) is the mean of the data, and \(n\) is the number of values. This formula helps in grasping how deviations from the mean are calculated throughout the data set, giving you clearer insights into data behavior.
Types of Standard Deviation in Excel
Excel provides several functions to calculate standard deviation: STDEV.P for population standard deviation and STDEV.S for sample standard deviation. Selecting the correct function is critical for your computations:
- STDEV.P: Use this when your data set includes the entire population.
- STDEV.S: Opt for this when your data set is a sample of the population.
Calculate Standard Deviation Using Excel Functions
Calculating standard deviation in Excel is straightforward and can be achieved through built-in functions. Here’s a simple guide on how to use these functions effectively.
Using the STDEV.S Function
To compute the sample standard deviation of a data set in Excel, follow these steps:
- Select an empty cell where you want to display the standard deviation.
- Type in the formula:
=STDEV.S(A1:A10)(replace A1:A10 with your range). - Press Enter, and your standard deviation will appear in the selected cell.
This function makes it easy to find standard deviation without having to manually apply the formula, streamlining your Excel calculations.
Calculating Standard Deviation from the Data Analysis Toolpack
Excel provides a Data Analysis Toolpak for more advanced statistical analysis. To calculate standard deviation using this tool:
- Ensure the Data Analysis Toolpak is enabled (File > Options > Add-Ins > Excel Add-Ins > Data Analysis).
- Go to the Data tab, click Data Analysis, and select Descriptive Statistics.
- Input your data range, check Summary Statistics, and click OK.
This method provides a comprehensive statistical summary, including standard deviation, mean, median, and variance.
Interpreting Standard Deviation Values
Once you’ve calculated the standard deviation, understanding what the values mean is crucial for data interpretation. A low standard deviation implies data points are closely clustered around the mean, while a high value indicates wide dispersion, signaling variability.
Practical Examples of Standard Deviation
Consider a data set representing exam scores: 75, 85, 90, 80, and 95. To find the standard deviation:
- Calculate the mean: \( \bar{x} = \frac{75 + 85 + 90 + 80 + 95}{5} = 85\).
- All deviations from the mean: [-10, 0, 5, -5, 10]
- Square those deviations: [100, 0, 25, 25, 100]
- Average them: \( \frac{100 + 0 + 25 + 25 + 100}{4} = 62.5\) (dividing by \(n-1\) for sample standard deviation).
- Take the square root: \( \sqrt{62.5} = 7.91\), so standard deviation is approximately 7.91.
This methodical approach illustrates not just how to use Excel but also how to understand the standard deviation in various scenarios.
Using Standard Deviation in Excel for Business Analytics
Businesses leverage standard deviation to understand consistent performance metrics and control quality. By assessing trends and variability in sales data, companies can identify high-performing products and areas needing improvement. For instance, a product with consistently low standard deviation indicates stable demand, while high standard deviation suggests fluctuations needing attention.
Key Takeaways
- Knowing how to use the Excel STDEV function aids in data analysis efficiency.
- Understanding the implications of standard deviation can significantly enhance your analytical skills.
- Utilizing statistical functions can streamline complex analyses in various professional fields.
FAQ
1. What is the difference between STDEV.P and STDEV.S in Excel?
STDEV.P is used for populations, while STDEV.S applies to sample sets. Using the correct function ensures accurate calculation of standard deviation.
2. How can I visualize standard deviation data in Excel?
To visualize standard deviation, consider using charts like histograms, which can depict the distribution of your data and highlight areas of concentration around the mean.
3. Can I calculate standard deviation for multiple data sets simultaneously?
Yes, by using the Excel functions across multiple columns or rows, or by utilizing summary statistics through the Data Analysis Toolpak, you can analyze various data sets concurrently.
4. What are some common misconceptions about standard deviation?
A common misconception is that a low standard deviation indicates data is ‘better.’ In reality, it just reveals less variability; data context is essential for comprehensive analysis.
5. How do I interpret standard deviation results in business reporting?
When interpreting standard deviation results, look at the mean and how values are dispersed to draw insights for performance improvement and decision-making. High variability can indicate risks or opportunities.
6. Can standard deviation be negative?
No, standard deviation values cannot be negative because they represent variability; they quantify the average distance of data points from the mean, so the result is always non-negative.
7. What if my data set contains outliers?
Outliers can skew standard deviation significantly. In such cases, consider using methods like trimming or applying robust statistical methods to minimize their impact on your analysis.