Essential Guide to How to Find Degrees of Freedom: Simplified Methods for Accurate Results in 2025
Essential Guide to How to Find Degrees of Freedom
Understanding Degrees of Freedom
**Degrees of freedom** is a critical concept in **statistical analysis**, representing the number of values that are free to vary in a given situation or analysis. This principle is essential for an accurate interpretation in various statistical tests, including hypothesis testing and regression analyses. For those questioning **how to find degrees of freedom**, it’s crucial to understand that it provides insight into how sample data relate to the entire population. Often denoted as \( df \), degrees of freedom guides statistical computations, influencing the behavior of estimators and test statistics. By grasping the **definition of degrees of freedom**, researchers can appreciate its importance regarding variability and constraints in datasets.
Degrees of Freedom Formula
The simplest way to express the **degrees of freedom formula** is \( df = n – 1 \) for a sample, where \( n \) is the number of observations. This formula is foundational in many statistical tests, including the t-tests and the calculation of sample variances. For instance, when measuring sample means, one must decrease the total number of independent observations by one (hence \( n – 1 \)). This adjustment captures the limitations imposed on estimating the population variance from a sample, highlighting the directly proportional **relationship between sample size and degrees of freedom**. As sample size increases, the degrees of freedom in the analysis also rise, enhancing statistical reliability.
Importance of Degrees of Freedom
The **importance of degrees of freedom** extends into various facets of statistical methodologies. In hypothesis testing, it helps determine critical values and the distribution used for test statistics—such as the t-distribution or chi-squared distribution. Moreover, observing how degrees of freedom impact the robustness of statistical tests illuminates the consequences of model fitting, especially in **understanding degrees of freedom in linear models**. A more accurate degrees of freedom count leads to better decision-making in interpreting results from statistical analysis, making this concept pivotal for researchers and analysts alike.
Types of Degrees of Freedom
Degrees of freedom can be categorized into several types that cater to different statistical testing contexts, facilitating accurate results based on specific scenarios. Understanding these **types of degrees of freedom** equips researchers with the ability to select the appropriate analysis method.
Degrees of Freedom in ANOVA
In Analysis of Variance (**ANOVA**), the calculation of degrees of freedom is fundamental for analyzing variance among groups. The formula can be segmented into between-group and within-group variations. In a one-way ANOVA, the degrees of freedom between groups is defined as \( k – 1 \), where \( k \) is the number of groups being compared. Conversely, the within-group degrees of freedom is expressed as \( N – k \), where \( N \) is the total number of observations across groups. This distinction is crucial when evaluating the **effect of degrees of freedom on statistical tests**, enabling a more nuanced interpretation of variances.
Degrees of Freedom in Regression Analysis
In **regression analysis**, degrees of freedom assist in assessing the fit quality of a model to data. The formula for calculating degrees of freedom in a regression context is \( df = n – k – 1 \), where \( n \) stands for the number of observations while \( k \) represents the number of predictors. A key aspect of understanding degrees of freedom in this context is recognizing their role in **estimating degrees of freedom** for residual errors, thereby influencing the reliability of predicted outcomes. Insights gathered from this can help in refining model fit and evaluating its predictive power effectively.
Calculating Degrees of Freedom for Different Tests
Being able to accurately **calculate degrees of freedom** is crucial in statistical hypothesis testing. The method used depends on the test conducted and the data structure.
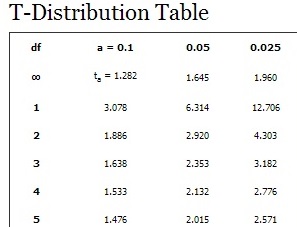
Degrees of Freedom in t-Tests
For a t-test, the degrees of freedom help assess the distribution of the test statistic against variability estimates. The general formula is \( df = n – 1 \) for single-sample tests, while for paired samples, it is \( df = n – 2 \). These calculations reflect the essence of measuring averages and variability in means, hence ensuring an accurate outcome in hypothesis testing. Further understanding of **degrees of freedom in t-tests** allows researchers to interpret p-values with better clarity, enhancing the accuracy of concluding statistical results.
Degrees of Freedom in Chi-Squared Tests
In a chi-squared test, degrees of freedom are a function of the total number of categories being analyzed. The formula is given as \( df = (r – 1)(c – 1) \), where \( r \) represents the number of rows, and \( c \) denotes the number of columns in the contingency table used for analysis. This influences the interpretation of statistical significance in the chi-squared distribution, illustrating the **significance of degrees of freedom** in determining test outcomes.
Practical Applications of Degrees of Freedom
Understanding and using degrees of freedom can immensely enhance the quality of any statistical analysis. The practical implications are vast across many fields, reflecting the real-world importance of effective statistical methodology.
Degrees of Freedom in Bayesian Statistics
In studying **degrees of freedom in Bayesian statistics**, one finds an interesting perspective bridging frequentist methods with Bayesian principles. Here, estimating uncertainty about parameters often leads to considering degrees of freedom in the context of informative priors. This statistical nuance improves model fitting and inference, providing more reliable parameter estimates while tackling complex analyses. Biostatisticians, for example, find this concept particularly useful when working with hierarchical models that involve multiple levels of variation.
Applications of Degrees of Freedom in Time Series Analysis
Similarly, **degrees of freedom in time series analysis** contribute to understanding the effects over time. In assessing trends and seasonality, careful calculations of degrees of freedom can reflect structural changes within the observed data. This insight allows analysts to model time-based data more accurately and can offer improved estimates in varying predictive settings, especially when confronting non-normal data. Recognizing these dynamics can be crucial when working to optimize forecast models and refitting analyses.
Key Takeaways
- Understanding degrees of freedom is essential for accurate statistical interpretation across various methods.
- Degrees of freedom formulas, such as \( n – 1 \) or \( (r – 1)(c – 1) \) play vital roles in statistical hypothesis testing.
- Applications of degrees of freedom span from linear regressions to time series analysis and beyond, enriching the analytical process.
- Investigating the types of degrees of freedom, especially in complex models, enhances modeling and fitting outcomes.
- Effective calculation methods help navigate the nuances of statistical significance across diverse tests and frameworks.
FAQ
1. What is the definition of degrees of freedom in statistics?
The **degrees of freedom definition** in statistics pertains to the number of independent values that can vary in an analysis post constraint application. It guides researchers in determining the validity of statistical tests and their results.
2. How do degrees of freedom affect the outcome of hypothesis testing?
In hypothesis testing, degrees of freedom influence the shape of the distribution used for test statistics, dictating the critical values and influencing confidence and significance levels associated with p-values. This understanding is key to interpreting results accurately.
3. What types of statistical tests utilize degrees of freedom?
Many statistical tests, including t-tests, chi-squared tests, and ANOVA, utilize **degrees of freedom** to determine the validity of their results. Each test employs specific degrees of freedom calculations to ensure appropriate analytical conclusions are drawn.
4. How can I calculate degrees of freedom for paired samples?
To calculate **degrees of freedom for paired samples**, the formula is typically \( n – 1 \), where \( n \) represents the number of paired observations. This calculation is vital for correctly applying statistical tests for mean differences between pairs.
5. Why are degrees of freedom essential in ANOVA tests?
**Degrees of freedom in ANOVA** are critical as they help partition total variance into components attributable to treatment and error, facilitating the assessment of group differences. They ensure appropriate responses to questions surrounding population means in experimental designs.
6. How do I know which degrees of freedom to use for my analysis?
Choosing the right degrees of freedom depends on the statistical test and dataset at hand. It’s essential to understand the context and objectives of your analysis to accurately apply the correct degrees of freedom for each scenario.
7. Can degrees of freedom be negative?
No, **degrees of freedom cannot be negative**. They represent quantities that are inherently linked to the number of observations and conditions of analysis, and they only take positive values or zero when measures or comparisons are made without any variability.